1.3.1Definition:-
The GRAPH
of an equation in two variables
x and y is the set
of all points in the xy-plane whose coordinates are members
of the solution set of the equation
So the Graph of an equation is just all
those points in the xy-plane which when plugged into the x
and y satisfy the equation. So with this in mind, we will
now freely use the words SKETCH or PLOT the GRAPH of an
equation,. This will mean that you are trying to give a
picture of the set that contains the solutions of a given
equation. This is where algebra is being converted to
geometry!! Here is an example:
Example#2
Sketch the graph of

Solution:-
Now here we are
looking for all
those ordered pairs (a,b) in the xy-plane
which when substituted for the x and the y in
the equation satisfy it. Well an easy way to
find such numbers is by picking values for x,
plugging them into the equation and noting the
resulting y value. This pair of x and y will
DEFINITELY satisfy the equation because it came
out of the equation.
Well, this can be done forever, because
there are infinitely many real numbers that I
can square!!!!
So the
solution set of
has infinitely many elements, and
we cant write them all down. And if we cant
write them all, we certainly can sketch them on
the xy-plane!! What to do?? Well, we don't have
to get them all. Let's get a few and sketch them
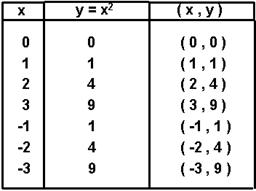
and see if we can get somewhere. Here are the
values I will choose for x, the corresponding y
values, and the resulting pair (x,y) that
satisfies the equation
When I plot these on
the xy-plane and connect them, I get
this picture
of the
graph
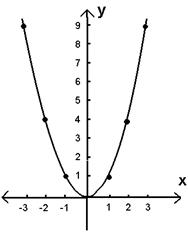
and this is good
enough for us FINITE
CREATURES.!!
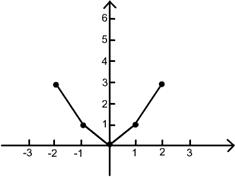
IMPORTANT REMARK.:-
It
should be kept in mind that the
curve in above is only an approximation
to the
graph of
When a graph
is obtained by plotting
points, whether by hand,
calculator, or computer,
there is no guarantee that
the resulting curve has the
correct shape. For example,
the curve in the
Figure here
pass through the points
tabulated in above table.
![]()
Previous
![]()
TOC
![]()
Next