COST BEHAVIOR
Cost behavior is the way in which total production cost is affected by fluctuations in the activity (production) level.
Activity level
The activity level refers to the amount of work done, or the number of events that have occurred. Depending on circumstances, the level of activity may refer to the volume of production in a period, the number of items sold, the value of items sold, the number of invoices issued, the number of invoices received, the number or units of electricity consumed, the labor turnover etc. etc.
Basic principle
The basic principle of cost behavior is that as the level of activity rises, costs will usually raise. For example; it will cost more to produce 500 units of output than it will cost to produce 100 units; it will usually cost more to travel 10 km than to travel 2 km. Although the principle is based on the common sense, but the cost accountant has to determine, for each cost elements, whether which cost rises by how much by the change in activity level.
Division of cost by its behavior
Basically the cost of production has two behaviors:
- Fixed Cost
- Variable Cost
Fixed Cost
It is a cost which tends to be constant by increases or decreases in the activity level.
Graph of Fixed Cost

This graph shows that the cost remains fixed regard less of the volume of output.
Examples include:
- Salary of the production manager (monthly/annual)
- Insurance premium of factory work shop
- Depreciation on straight line method
Variable Costs
A variable cost is a cost which tends to very directly with the change in activity level. The variable cost per unit is the same amount for each unit produced whereas total variable cost increases as volume of output increases.
Graph of Variable Cost
Rs.

Volume of output
This graph shows a proportionate increase in the cost by the increase in the activity level.
Examples include:
- Cost of raw-material consumed
- Direct labor cost
- Selling commission
Further division of cost behavior
- Step fixed cost
- Semi variable cost
Step fixed cost
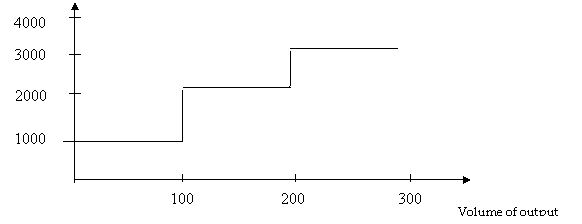
A step fixed cost is the cost which is constant for a specific range of activity and rises to a new constant level once the range exceeds. The range over which the fixed cost remains constant is known as the relevant range.
For example; the depreciation of a machine may be fixed if production remains below 100 number of units per month, but if the production exceeds 100 number of units, a second machine may now be required, and the cost of depreciation would go up a step. Other examples include:
a. Rent of workshop (in case of increase in the production one needs to rent one more workshop)
b. Salary of supervisor (increase in output will be supervised by increased number of supervisors)
Graph of Step fixed Cost
Rs.

This graph shows a stepwise increase in the total cost. Relevant range in this graph is of 100 numbers of units.
Semi Variable Cost
It is also known as mixed cost. It is the cost which is part fixed and par variable. It is in fact the mixture of both behaviors.
Examples include: Utility bills – there is a fixed line rent plus charges for units consumed.
Salesman’s salary – there is a fixed monthly salary plus commission per units sold.
The graph of semi variable cost is as follow:
Rs.
Cost

100 200 300 400 500 Output
This graph shows a fixed cost of Rs. 2,000 and there after the cost is variable.
COST BEHAVIOR PER UNIT OF PRODUCTION
Cost per unit behaves differently than the total cost of production. Following tables show the difference in behavior.
Increasing Production Volume Situation
Decreasing Production Volume Situation
|
|
Per Unit |
Total |
|
Fixed Cost |
Increase |
Constant |
|
Variable Cost |
Constant |
Decrease |
|
Total Cost |
Increase |
Decrease |
Increase or decrease in production volume causes no change to the variable cost per unit it remains constant, assuming there is not rebate in case of bulk purchase and the labor receives constant rate despite change in production volume.
Whereas, increase in production volume causes a decrease in fixed cost per unit and in the same way a decrease in production volume causes an increase in fixed cost per unit.
Following example helps understanding this concept.
Total fixed cost = Rs. 4,000
Per unit variable cost = Rs. 3
Cost per unit at different activity levels 1000, 2000, 4000, and 5000 units
|
|
1000 units |
2000 units |
4000 units |
5000 units |
|
||||
|
|
Rs. Per Unit |
Total Rs. |
Rs. Per Unit |
Total Rs. |
Rs. Per Unit |
Total Rs. |
Rs. Per Unit |
Total Rs. |
|
|
Fixed Cost |
4 |
4,000 |
2 |
4,000 |
1 |
4,000 |
0.8 |
4,000 |
|
|
Variable Cost |
3 |
3,000 |
3 |
6,000 |
3 |
1,200 |
3 |
15,000 |
|
|
Total Cost |
7 |
7,000 |
5 |
10,000 |
4 |
16,000 |
3.8 |
19,000 |
|